

Healthcare · United States
673 clicks in the first ten weeks after the rebuild
A healthcare clinic in the United States. Nothing that could identify the practice appears here, which is how I handle every medical account.
- 673
- Clicks since the site went live
- 94K
- Impressions in the same window
- 22
- Clicks on the best day so far
- 13 of 21
- Service terms in the top three
The old site was being found for its own name and almost nothing else. I rebuilt it from nothing, and ten weeks later Google was quoting it in AI answers.
The numbers
Everything this engagement produced, in one place.
- 673
- Clicks since the site went live 21 June to the start of September, on a Search Console property created that same week.
- 94K
- Impressions in the same window Before the rebuild the site was being shown for its own name and very little beyond it.
- 9
- Clicks a day, averaged across the window 673 across 73 days, and that average carries the first weeks, when the site was days old.
- 22
- Clicks on the best day so far The line is still climbing. This is not a peak it has come down from.
- 13 of 21
- Service terms in the top three Seven of them at number one. Brand searches are excluded, because those were the only ones already working.
- 13.3
- Average position, everything included Across all 94,000 impressions, including the terms the site has only started to reach.
What I walked into
A site that had been up for years, looked its age, and had nothing behind it. No structure worth the name, no service pages that answered what people were typing, nothing that would let Google understand what the clinic actually does.
The only searches finding it were people typing the clinic’s own name. That is not a search you win. It is a search you are given, by people who already know you exist and are only looking for the phone number.
For every service the clinic actually treats, it was invisible.
Why I rebuilt it instead of repairing it
I do not default to a rebuild. On the cardiologist I worked with, I kept the design he had made and put every hour into the content instead, because his site was not the thing in the way.
This one was. A site with no structure is not a site with a content problem, and no amount of rewriting fixes a foundation that was never poured. Patching it would have cost most of what a rebuild costs and left the same ceiling in place.
So it came down and went back up from nothing: new structure, new pages, new content, all of it built around the services people search for rather than the way the clinic happens to describe itself internally.
What the structure actually does
Every treatment the clinic offers got its own page, written for the person searching for that one thing rather than for a list of services.
That sounds obvious. It is also the single most common thing missing from the healthcare sites I am asked to look at, where six treatments share one page and none of them rank, because a page about six things is not the best answer to any of the six questions.
Then the blogs, covering what people ask before they are ready to book, each one pointing back into the service page it belongs to. The service pages hold the ground. The blogs bring people onto it.
The first week told me it was right
The site went live and was verified in Search Console on 21 June. It started returning clicks in its first week, with days in double figures inside the first fortnight, on a property Google had known about for a matter of days.
New sites are not supposed to do that. This one did because the clinic already had a real business behind it and the new structure finally let Google see what that business was. The authority was there. Nothing had been built to carry it.
What it looks like now

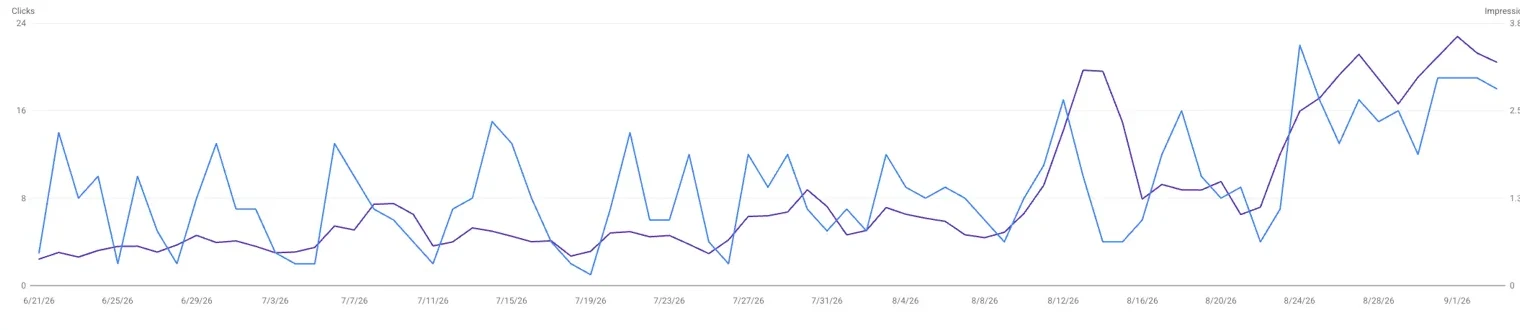
673 clicks and 94,000 impressions, at an average position of 13.3 across everything. Averaged over the 73 days, that is just over nine clicks a day, and that average is dragged down by the weeks when the site was brand new.
The best day so far is 22. The shape of the graph is the part I would point at rather than any single figure: both lines are higher at the right edge than anywhere before it, which is what a site still climbing looks like.
Where the pages sit
Of the 21 service and treatment terms I track, 13 are in the top three and seven are at number one. Brand searches are left out of that count, because those were the only ones working before I arrived and counting them would be marking my own homework.
Google’s AI answers now cite the clinic on those service searches too, more than once inside the same answer. A patient asking Google about a treatment gets the clinic named in the reply, above the results.
This one is not finished
Ten weeks is early. Both lines are still going up, the terms that have not reached the top three yet are the ones I am working on now, and the interesting question is what this looks like at six months rather than at ten weeks.
I am publishing it early on purpose. A case study written at the point everything has settled tells you what a finished result looks like. This one shows you the part owners actually have to sit through: the first ten weeks, from nothing, with the line going in the right direction and nowhere near where it will end up.
This engagement ran on SEO, Web Design, Google Business Profile Optimization and Content Marketing. Results are measured the way the guarantee defines them: calls, leads, and booked work. Your own market decides your own numbers.
Want numbers like these in your own market?
Book a free consultation. I will show you what is standing between your business and the calls, the same way I did for this healthcare client.